A Humanistic Approach to Big Data
A Case Study of the Environmental Protection Agency
When big data is mentioned, what is the first thing that comes to mind? Something like this?

Or perhaps something more like this?

What probably does not immediately come to mind is the countless number of ways that big data is being used to combat environmental issues. While creating reports and running analyses are certainly key components to operationalizing growing stores of organizational data, the possibilities of big data—and the modern analytics tools used to wield it—are opening up new ways to use data to solve human problems.
Not only are analytics tools themselves becoming more human-centered with increasingly intuitive, fast, and accessible interfaces and analytical capabilities, but they also allow organizations to leverage data to solve real-world, global issues such as environmental challenges. Additionally, they make it easier for people to collaborate with one another and share data to create points of immediate connection and impact. Modern data analytics tools like Qlik Sense® use machine learning (ML) and geospatial analytics to create sustainability for the environment by helping technology and humans work together effectively and efficiently for the betterment of our communities and world.
Thinking Like A Human to Help Humans: How the EPA Uses Qlik to Protect Human Health & the Environment
In a world riddled with human-made problems such as climate change, destructive weather, pollution, and degradation of air, water, and land, tools need to “think like humans” to understand and analyze complex datasets by connecting analytics to the concrete problem at hand. In the case of the U.S. Environmental Protection Agency (EPA), it was time-consuming and costly to use data to carry out environmental analysis, strategic activity planning (e.g., accelerating the pace of cleanups or implementing pollution control measures), and internal and public communications. Convincing organizations to adopt new ways of working with data and innovative technologies can be difficult—especially ones like the EPA that look at broad scopes of data—but the payoffs are immense. To address issues ranging from air pollution, climate change, chemicals, and toxins to sustainable cleanup, health, waste cleanup, and water quality, the EPA required a solution that would build a more data-centric agency.
The Humanistic Approach
By adopting Qlik, the EPA implemented solutions that were immediate and impactful. Qlik enabled the EPA to operationalize data to help solve some of these environmental challenges—whether human-made or caused by natural phenomena—by allowing the agency to drive insights and collaborate efficiently. Since adopting Qlik, the EPA has been able to address these issues by leveraging various Qlik Sense features. The following are just a few of the applications that have resulted in measurable outcomes:
- Air quality monitors provide regional reporting and track chemical movement, and the EPA uses geo-analytic capabilities to show hotspots where chemicals are originating. Geo-analytics is also key in hurricane and wildfire prevention, with multiple dashboards tracking Northern California wildfire spread and wind movements. Qlik’s built-in geospatial analytics were critical in finding a solution to these issues and providing comprehensive mapping capabilities, such as national scale mapping, statistical analytics, and spatial analytics, including geocoding.
- Pollution prevention dashboards track pollutants over time to determine where waste is originating by identifying correlations between locations, pollutants, sources, and sectors. Using Qlik’s self-service visualization and discovery features, the EPA is able to drill into data and shift focus on the fly within the dashboards to track progress and determine which types of pollutants are affecting which regions.
- Water quality indicator dashboards helped identify several missing metadata elements in Water Quality Portal data that had limited the usability of approximately half of the available nutrient water monitoring records. Users can now identify specific missing metadata elements available in the Water Quality Portal data as well as ways to improve usability of the data. Qlik’s Associative Engine changed the EPA’s previous restricted, linear, query-based exploration to a powerful associative engine, enabling a more robust, 360-degree perspective and the ability to explore data flexibly and intuitively. The EPA can now find data related to water quality issues that it would otherwise be unable to locate and utilize.
- The data produced by network sensors for water pollution is analyzed to provide interactive visualizations and run analytics in Qlik, further allowing the EPA to find solutions for environmental mishaps such as the Flint Michigan Water Crisis. Additionally, Qlik’s Search and Conversational Analytics features help users by providing insights and answers to questions asked in natural language through Qlik’s artificial intelligence (AI) and ML integrated insight advisor. Even users with minimal knowledge of data analytic tools are able to search through the data and track specific fields that are pertinent to their research.
Results of Human & Data Collaboration
Since adopting Qlik Sense as its primary business intelligence (BI) tool, the EPA:
- Utilized more than 3,000 Qlik Sense account users
- Added 100-200 new users per month
- Logged 300 weekly users
- Spread its Qlik user base across units throughout the EPA nationwide
Taking advantage of Qlik’s guided analytics and self-service visualizations has enabled the EPA to collaborate with one another, communities, and their data to help fulfill its mission. The opportunity for connection between technology and humans through big data is powerful and rewarding. Having a tool that thinks more like a human to help humans help one another is not only useful for analytics but also beneficial for the longevity of our planet. Environmental protection is just one of the ways big data is helping humans help each other.
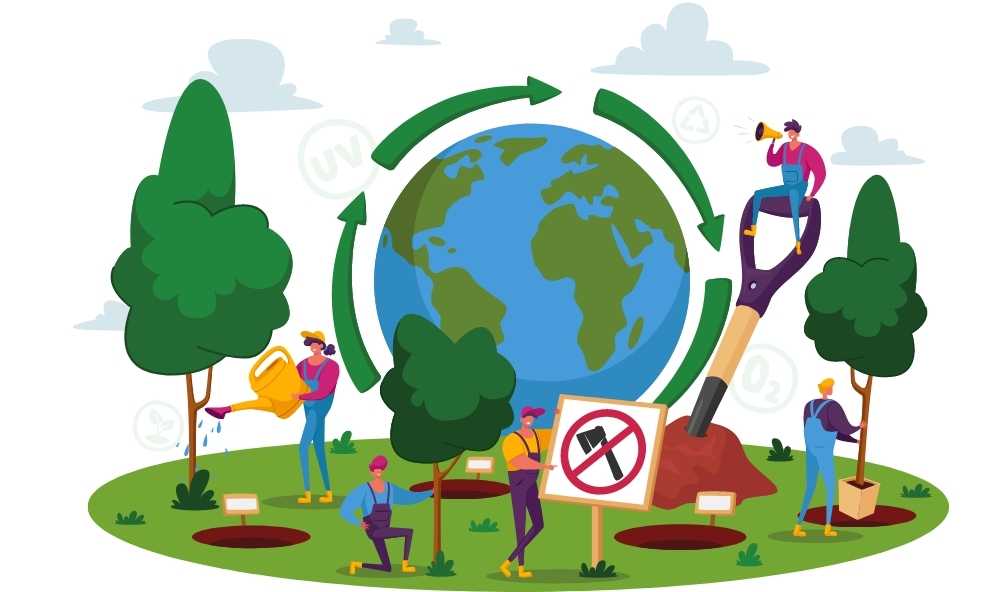
Perhaps the EPA’s data journey has changed your image of big data to something more like this:


